https://docs.google.com/file/d/0B5co9v8mXNu2dm51amtZMFlFbjA/edit?usp=sharing
Wednesday 11 September 2013
Assignment 2 Process

1. The data and graphics needed are collected and edit in Adobe Photoshop.

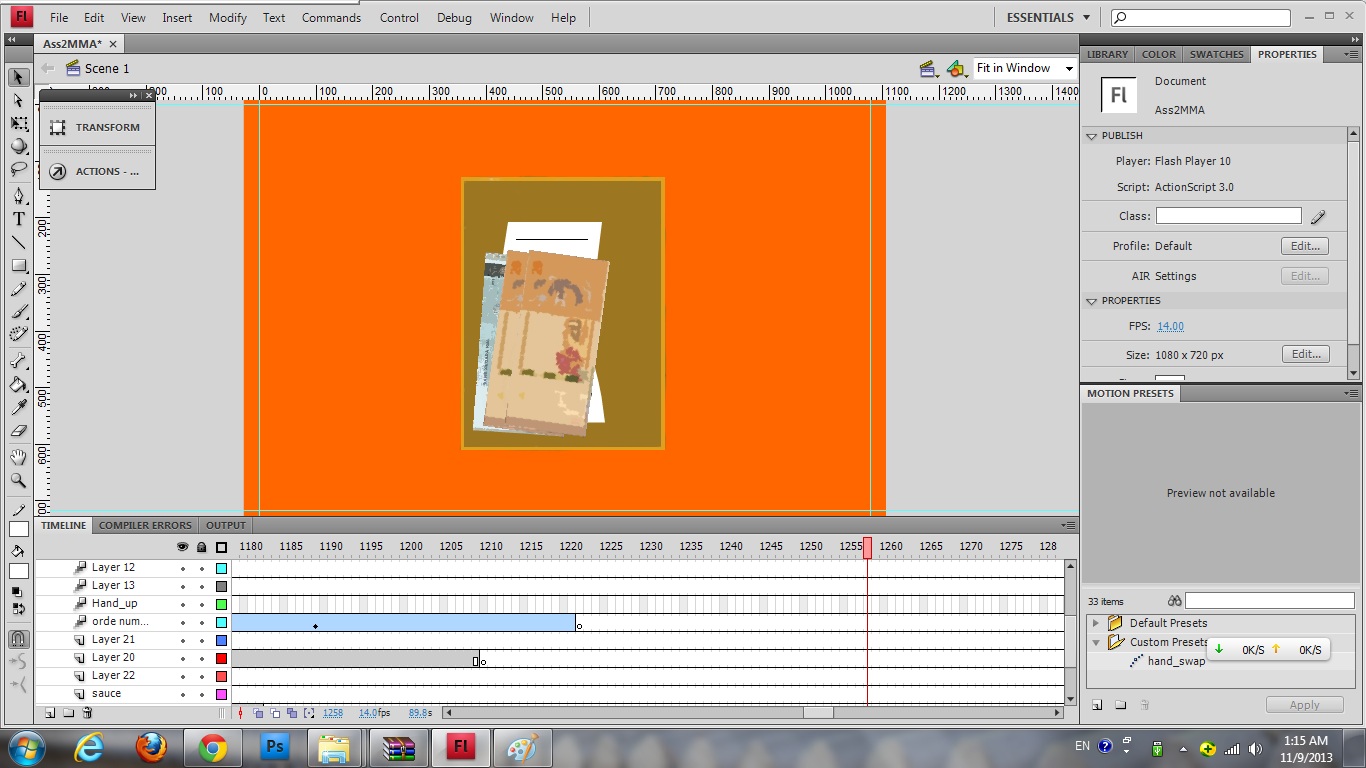
2. The edited data and graphics are then import to Flash and start to arrange the setup of the video and implement animation by Motion Tween. I started with the middle scene (food section).

3. The animating continues to bring more elements inside. The hands are animated such as it will change the flow of movement at the interval of 10 seconds.

4. The final part of the hands motion change.

5. The hands started to disassemble the second scene in order to move to the final scene.
6. The final scene of the animation indicated the ending of the info-motion, depicting the total amount of money spent in a week food delivery.

7. Finally, back to the first scene, rather the making of the opening of the info-motion. This part is the last part to animate since the flow is still in develop.
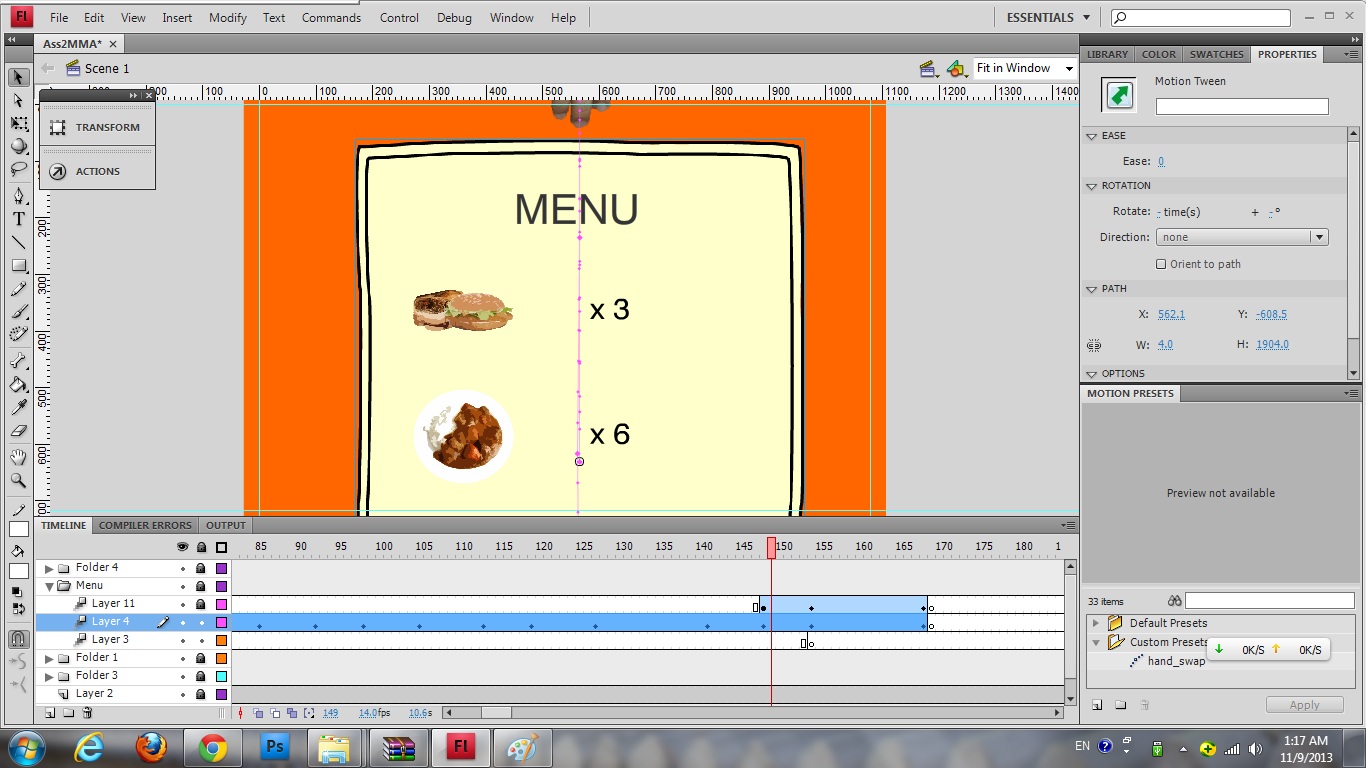
8. The first scene (the menu).
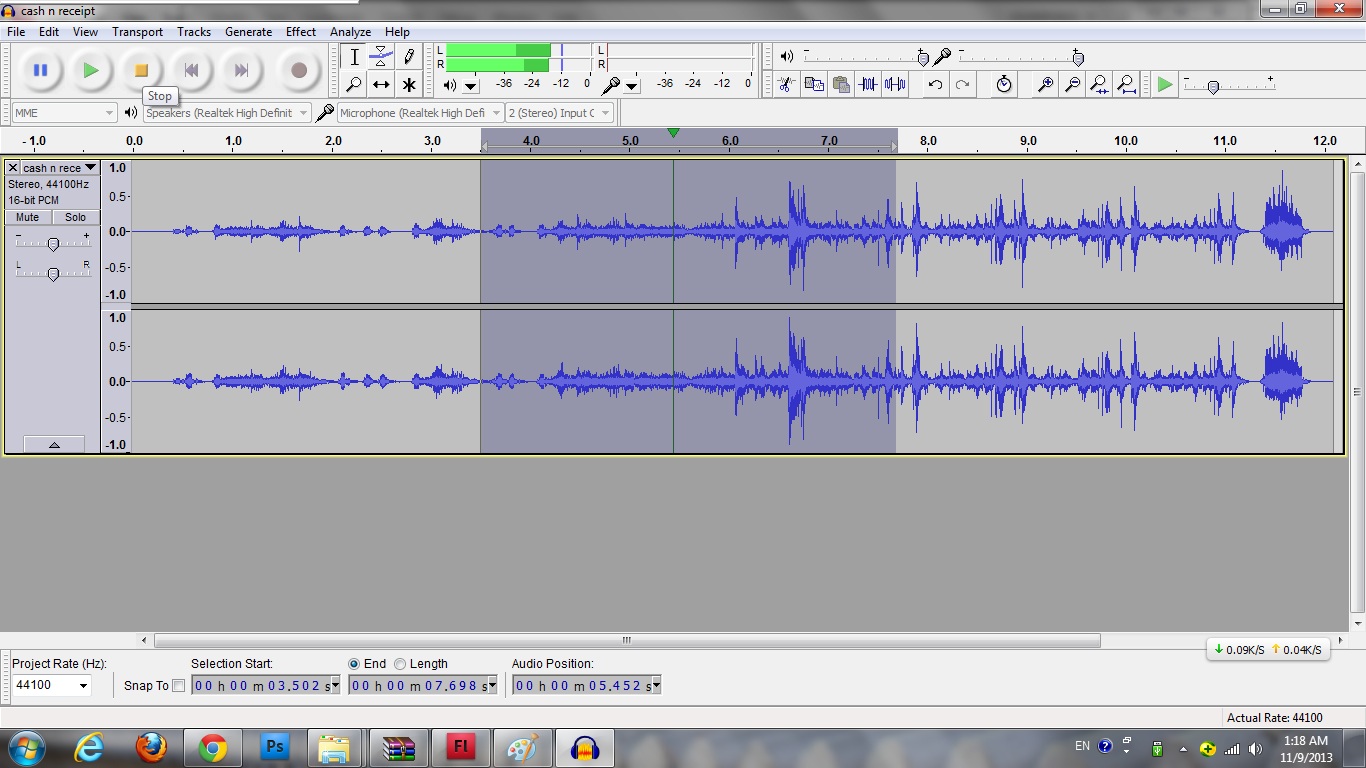
9. Now that the animation almost finish, the preparation and configuration of background music and sound effect is done in Audacity.

10. The background music and sound effects are added to the flash. Make sure the sound be where it suppose is.
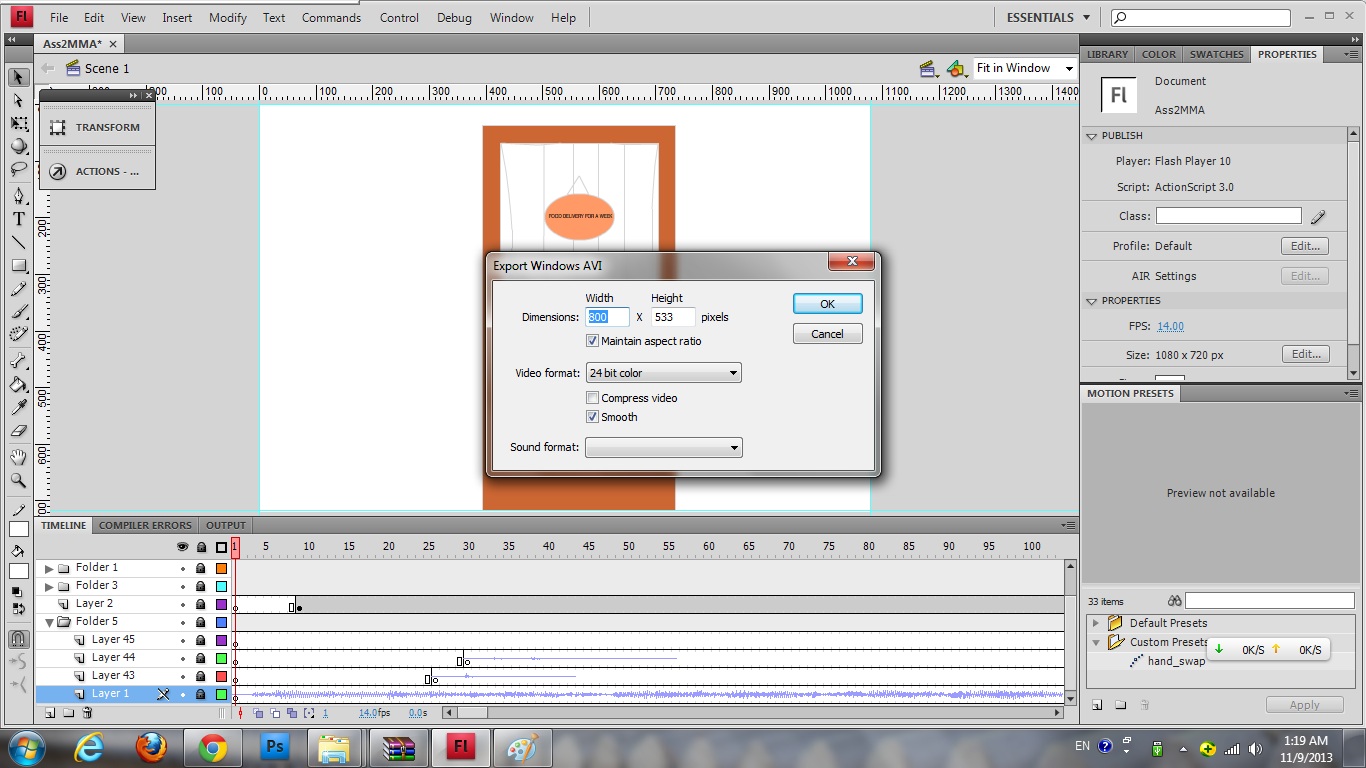
11. After that, the animation is ready to test. If no problem, the animation will be exported to avi Video.

Tuesday 10 September 2013
Assignment II The Info-motion - Data Gathering
Literally, my subject is the food delivery that I ordered and recorded regarding what food(type), and the prices of the order.
Here is the result


Here is the result


Tuesday 9 July 2013


Wednesday 26 June 2013
A Summary of Subject and its Reason
After a brief discussion with Mr Badrolhisham, I decided to make a non-electronic media presentation which can be called a small installation diagram with interactivity for audience. The subject will be Air Pollution Index and the area of data collection will focus on Selangor. I decided to use dust masks (primary option) while PVC-made asthma inhalers still an appealing option as the main highlight. The background design will be focus on recent haze incident in Malaysia.
The reason of the choice is due to the Indonesian forest burning activities which has effect South-east Asia particularly on Singapore and the south part of Peninsula of Malaysia. Johor, Negeri Sembilan and Melaka suffered the worse while KL, Selangor and Pahang are in tight spot. The 'misty-brown' covering also made its way to Cyberjaya, Selangor which is where I am staying to pursue my multimedia experience in Multimedia University. With the figure of API 160+- (prompt more or less), the air around MMU is hard to breathe for somebody who is sensitive. I am a little bit sensitive so mostly I stay in my rented room and hope for a clean cool wind which come at 26 June when rain with its strong wind temporarily blown the thick haze away. At last, clean air for a first time in almost a week time. But the haze will or might be back tomorrow as environmental scientists stated that the thick coating of dust and smoke might stay until August if the situation goes on. My subject will be a reminder for us that even clean, soothing and fresh oxygen is a bless even though it is considered a common privilege for many of us including me, myself.
The reason of the choice is due to the Indonesian forest burning activities which has effect South-east Asia particularly on Singapore and the south part of Peninsula of Malaysia. Johor, Negeri Sembilan and Melaka suffered the worse while KL, Selangor and Pahang are in tight spot. The 'misty-brown' covering also made its way to Cyberjaya, Selangor which is where I am staying to pursue my multimedia experience in Multimedia University. With the figure of API 160+- (prompt more or less), the air around MMU is hard to breathe for somebody who is sensitive. I am a little bit sensitive so mostly I stay in my rented room and hope for a clean cool wind which come at 26 June when rain with its strong wind temporarily blown the thick haze away. At last, clean air for a first time in almost a week time. But the haze will or might be back tomorrow as environmental scientists stated that the thick coating of dust and smoke might stay until August if the situation goes on. My subject will be a reminder for us that even clean, soothing and fresh oxygen is a bless even though it is considered a common privilege for many of us including me, myself.
Wednesday 19 June 2013
Research and Statistical Data
Did a bit of studying, the definition of research based on Google is
"The systematic investigation into and study of
materials and sources in order to establish facts and
reach new conclusions"
Literally, it means study and investigate about a topic in terms of our limited knowledge and data and with finding the source where the topic come to and study it.
For statistical data, it is more or least means the raw collection of materials of surveys and experiments, usually in quantities (numbering) which is been organised, analysed, interpreted and presented in table, graph, chart or pictorial presentation.
Know that this terms has been made know to me, the collection and studying for the subject should be more streamline with understanding of the process I need to go through.
Tuesday 11 June 2013
Statistical Data Hunting
Now we are dealing with real published and proved research, surveys and reports. First, we need to find some samples for a subject.
http://data.worldbank.org/country/malaysia
http://www.statistics.gov.my/portal/index.php?option=com_content&view=article&id=363&Itemid=169&lang=en

http://www.statistics.gov.my/portal/download_Environment/files/Environmental_Statistics_Time_Series_Malaysia_2012.pdf
http://sdwebx.worldbank.org/climateportal/index.cfm?page=country_historical_climate&ThisRegion=Asia&ThisCCode=MYS
http://www.statistics.gov.my/portal/images/stories/files/LatestReleases/findings/Summary_findings_Migras2011.pdf
http://www.statistics.gov.my/portal/images/stories/files/LatestReleases/ppi/2012/FEB/Press_Release_PPI_Feb_2012_BI.pdf
Second Year New Challenge
Hello, dear blog which been a good friend and presenter since my first year in MMU, it is been a while since I come to update you. My apology as I am a selfish who will only talk to someone I meet regularly and you are not on the list. Well, anyway since that the second year has come and with it a new challenge as we shifted our focus of studies from expression to aesthetic information design. Now we are design something for the purpose of public audience, no longer walling in the circle of peers and lecturers. All right, I will get start. Get set, ready. BANG!! GOOOO!!!
Monday 21 January 2013
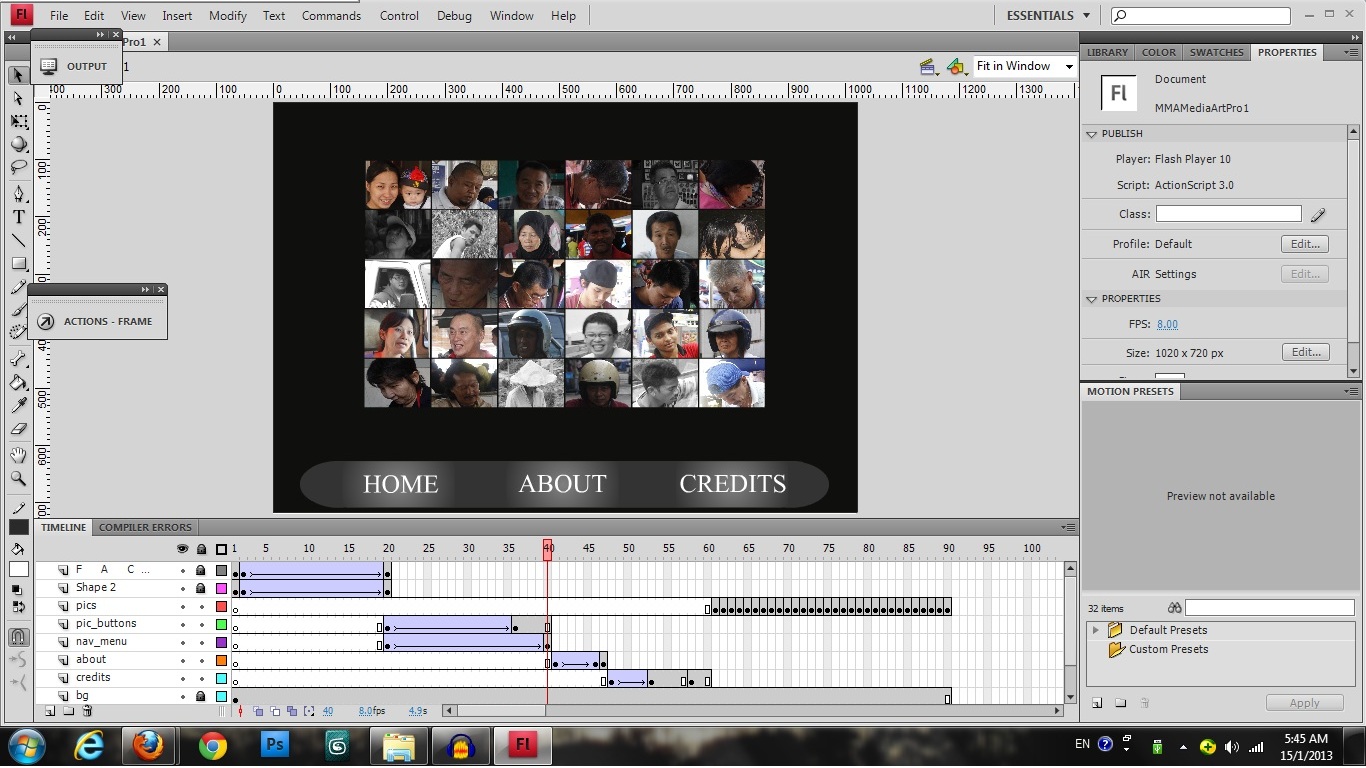
FACES - Introducing the Application

The first page consists of only a button called "ENTER". Click to enter.
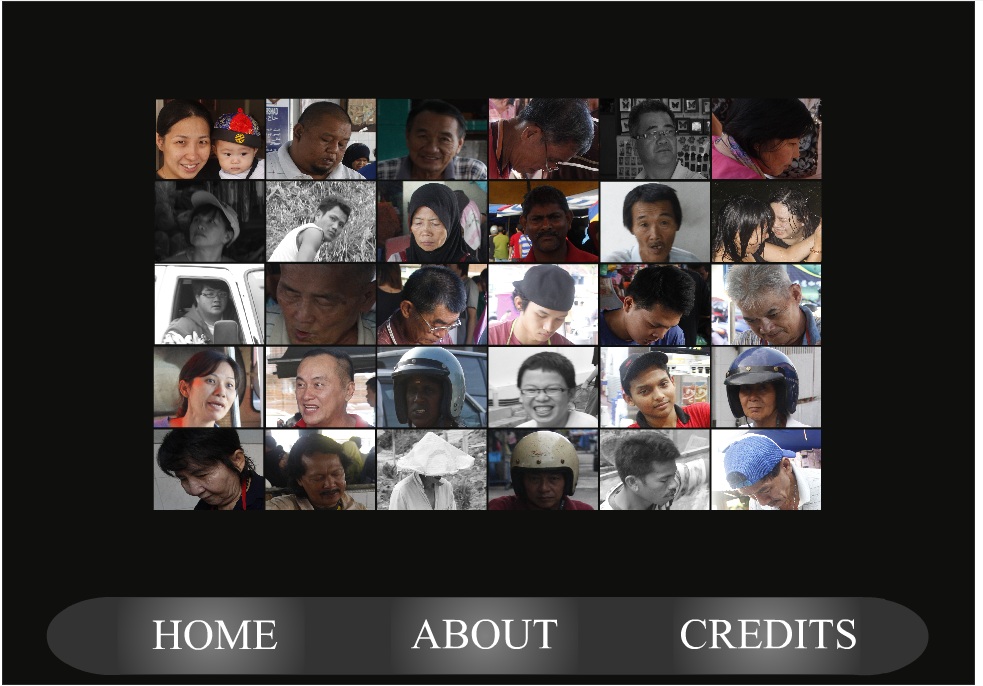
After the brief loading (wait till all the panels in place), you can either press the 30 picture buttons above or navigate to other page with the navigation bar below. The 30 buttons will be the gate to the main dish of the day - 30 pictures of different people working on the lower strata of the food web (society). While the main dish is served, you can also navigate to other pages with three different buttons below. "HOME" is the button straight back to the first page, "ABOUT" is the button to the introduction about the author of this application and his artist statement regarding this project and "CREDITS" button is directed to the page of acknowledgement of people and software that made this interactive multimedia possible.
Life is an exploration. Enjoy the world. Thank you.


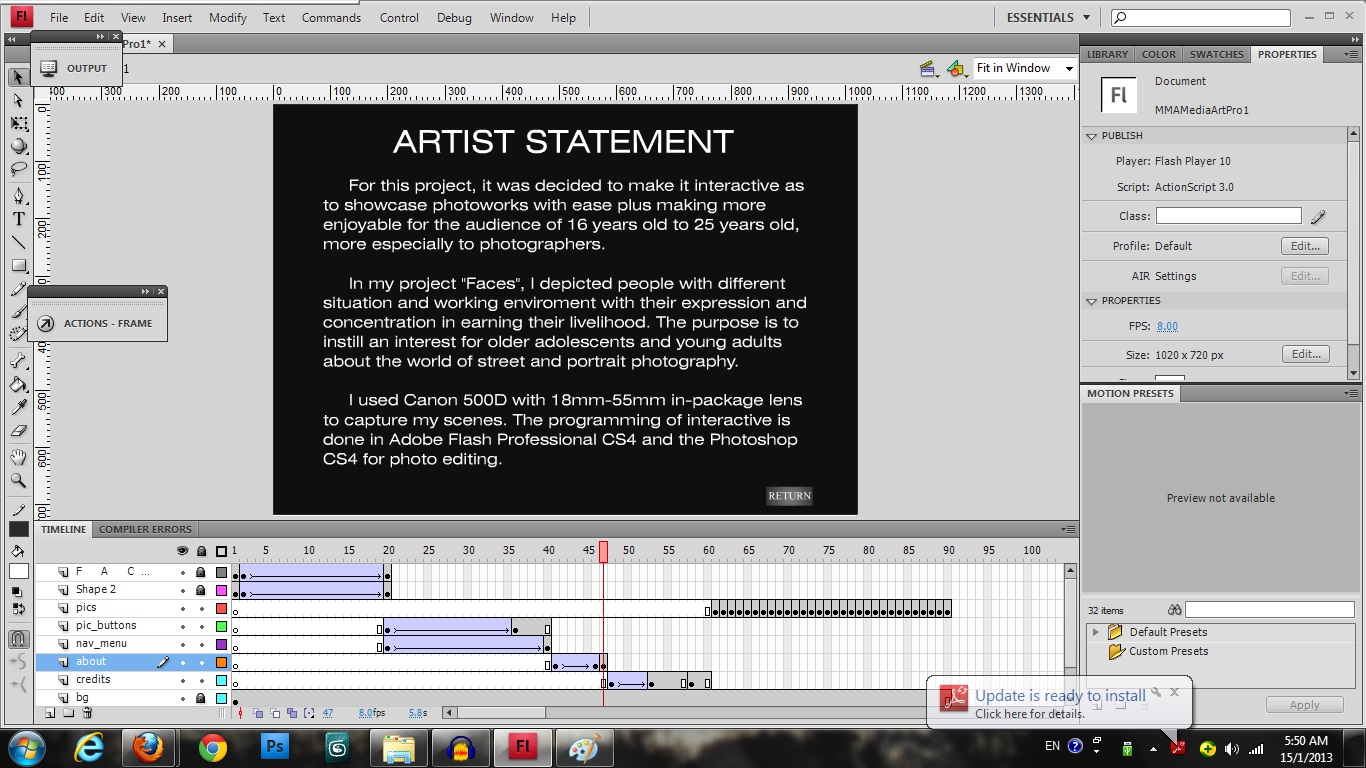
Artist Statement for Project 1
Artist Statement
For this
project, it was decided to make it interactive as to showcase photo works with
ease plus making more enjoyable for the audience of 16 years old to 25 years
old, more especially to photographers.
In my project "Faces", I
depicted people with different situation and working environment with their
expression and concentration in earning their livelihood. The purpose is to instil
an interest for older adolescents and young adults about the world of street
and portrait photography.
I used
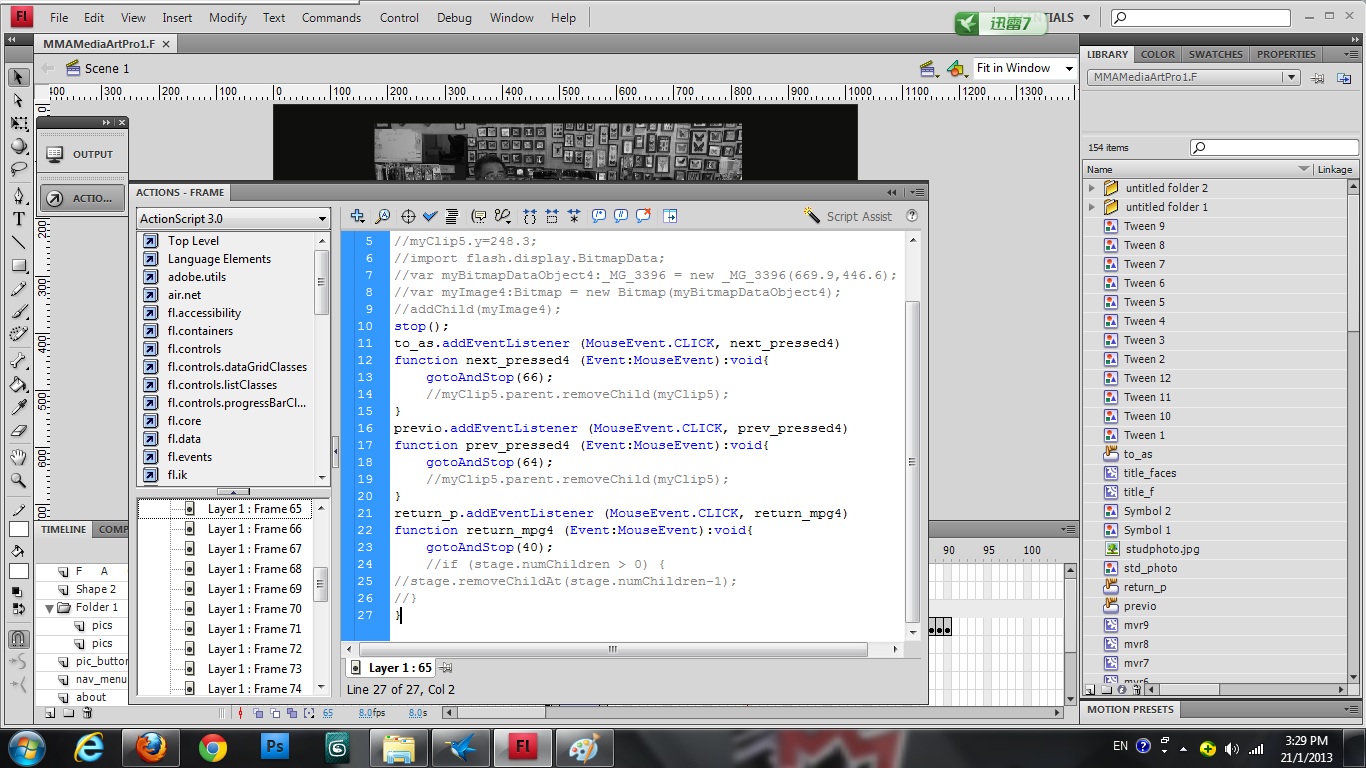
Canon 500D with 18mm-55mm in-package lens to capture my scenes. The programming
of interactive is done in Adobe Flash Professional CS4 and the Photoshop CS4 is
for photo editing. The file is published with EXE extension with Adobe Flash
Player 10 preset, users must have the player installed before using this
interactive application.
Tuesday 15 January 2013


Subscribe to:
Posts (Atom)